Examples
Example 1: In-school NPIs
Experiment design
In this hypothetical example we study in-school nonpharmaceutical interventions (NPIs) to be implemented in all K-12 schools of a county (Montgomery county, Virginia) when a COVID-19-like disease starts to spread in the county from a few importations. It demonstrates how public health decision makers can use EpiHiper-based simulation experiments to evaluate different intervention policies for situation assessment and/or course-of-action analysis.
Hypotheically, we are interested in the following NPIs.
Hybrid learning: schools are open every Monday, Tuesday, and Wednesday for in-person learning, but closed every Thursday and Friday for remote learning.
In-school testing: * Daily antigen test: test everyone in school (including students and teachers) every in-person day; results come out on the same day with 80% sensitivity. * Weekly PCR test: test everyone in school (including students and teachers) every Monday; results come out the next day with 95% sensitivity.
Home isolation: students and teachers with positive results are required to stay home for 14 days.
We want to evaluate the effects of these NPIs and to compare the two testing strategies in terms of reducting infections. We consider a base scenario and two intervention scenarios.
Scenario A: base scenario, no NPIs.
Scenario B: hybrid learning from day 0; daily antigen test + home isolation from day 30.
Scenario C: hybrid learning from day 0; weekly PCR test + home isolation from day 30.
Prepare simulation input files
Contact network. The contact network file (va_montgomery_contact_network_m5_M40_a1000.txt) of Montgomery county, Virginia can be downloaded here.
Person database. The personTrait database file (va_montgomery_persontrait_epihiper.txt) of Montgomery county, Virginia can be downloaded here.
Disease model. This hypothetical example concerns the early stage of a COVID-19-like pandemic. We assume a single virus variant and ignore immunity waning. There is no vaccine yet. Therefore the disease model consists of S (susceptible), E (exposed but not yet infectious), Ipresymp (pre-symptomatic and infectious with a lower infectivity), Isymp (symptomatic with full infectivity), Iasymp (asymptomatic with full infectivity), and R (recovered) states. See the disease model file for parameterization of the states, the transmissions and the transitions.
Initialization. At the beginning of the simulation, everyone is in S state. There are 5 infections every day for 10 days (tick 0 to tick 9) due to importations. See intervention seed in the intervention file. Since it is implimented as an intervention, the initialization file is basically empty.
Intervention. An intervention file is prepared as a template and is customized for different scenarios. It includes close_schools intervention for hybrid learning, antigen_test intervention for daily antigen test, PCT_test intervention for weekly PCR test, and home_isolation intervention for home isolation. Target of testing interventions is a set inschool_nodes of all individuals studying or working at schools, and the set is defined as all nodes who have either an edge on which the node has a school activity type or an edge on which the node has a work activity type while the other node has a school activity type. We assume that a node may be found positive if tested in any of the infectious states (Ipresymp, Isymp, Iasymp). People tested positive are kept track of using nodeTrait to_start_isolation. On remote learning days all school_edges are removed (edge weight being scaled by 1/1000000). Intervention home_isolation removes non_home_edges of the node for 14 days.
Traits. To keep track of nodes tested positive and to be isolated, a nodeTrait to_start_isolation is defined in the traits file.
Other JSON files. The scenario.json file specifies location of the above 6 files. In the config.json file we specify simulation duration (day 0 to day 300) and paths of output files.
Make a subdirectory for each scenario, eg. Scenario-A. For scenario A, copy intervention-A.json (and rename it to intervention.json) and the other JSON files (disease.json, initialization.json, traits.json, scenario.json, config.json to its subdirectory. Similarly for scenarios B and C. Run the simulation with EpiHiper built with option -DENABLE_LOCATION_ID=OFF (since the provided contact network file does not have location id column).
Run experiment and interpret output
Usually one needs to run each scenario for multiple replicates. With the same model parameterization EpiHiper produces different outputs each time it runs due to the stochasticity of the simulation. From the output of many replicates, one can estimate interested epidemic measures (eg. total number of infections) with uncertainty quantification.
We explain the output files using those generated by a simulation run of Scenario A with config-reproducible.json (where a random seed is specified). The EpiHiper executable used for the simulation was built with instructions for a single threaded executable. The output files generated with config-reproducible.json for the three scenarios are available here.
Individual level output data records all health state changes occurred to each individual. E.g., the first and last few lines of A-output.csv file:
tick,pid,exit_state,contact_pid
0,3742555,E,-1
0,3799733,E,-1
0,3747592,E,-1
0,3739527,E,-1
0,3791714,E,-1
1,3787092,E,-1
1,3742462,E,-1
1,3738911,E,-1
1,3803675,E,-1
...
296,3766845,Iasymp,-1
297,3762791,Iasymp,-1
297,3798150,Isymp,-1
297,3731385,Ipresymp,-1
298,3802698,R,-1
299,3731385,Isymp,-1
299,3805636,E,3731385
299,3728304,R,-1
299,3766844,E,3766845
299,3757852,R,-1
Column tick is the time of the state change. Column pid is the person ID of the individual with this change. Column exit_state is the state of the individual after the change. Column contact_pid is the person ID of the individual that transmits the disease to the person with this state change. It is -1 if the change is not a transmission or if the infection is an importation (so the infector is out of this population). For example, line 2 to line 6 are infections of 5 people with outside infectors on day 0; line 296,3766845,Iasymp,-1 is a transition of health state of individual 3766845 to Iasymp on day 296.
> grep 3778633 A-output.csv
13,3778633,E,3756952
16,3778633,Ipresymp,-1
18,3778633,Isymp,-1
23,3778633,R,-1
The above shows the trajectory of individual 3778633: infected by 3756952 on day 13, changed to Ipresymp on day 16, changed to Isymp on day 18, recovered on day 23.
Note that joining this output data with the person database allows us to compute epidemic measures of a subpopulation, e.g. daily number of infections in the age group 5-17 assuming age is given in the person database.
Aggregate output data records number of individuals entering [in], exiting [out], and being in [current] each health state, as well as values of variables defined in intervention file, at each tick. If we do not need individual level details, we can run analytics using this file.
Results
We run 30 replicates for each scenario with config.json and visualize temporal evolution of new infection numbers in different scenarios. Fig. 2 is produced from aggregate output data. It shows the cumulative infections, as a percentage of the county population, over time. The in-school NPIs reduce infections significantly: the overall attack rate (total number of infections normalized by population size) decreases from about 10% in Scenario A to less than 7.5% in Scenarios B and C.
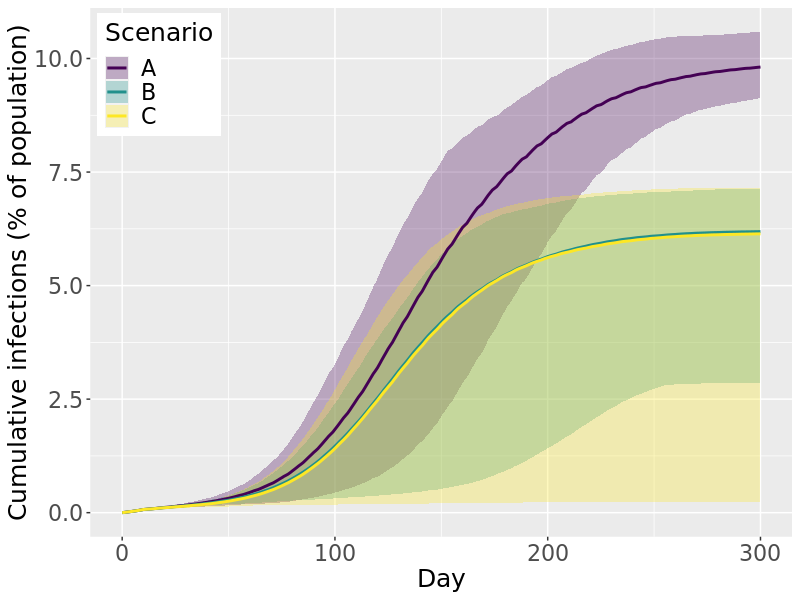
Fig. 2 Cumulative infections over time. Lines are mean values; ribbons are 90% projection intervals.
Fig. 3 is produced from individual level output data, by joining it with age column in the person database. It shows weekly new infections (normalized by age group size) in each of five age groups, in different scenarios. It seems the in-school NPIs mainly reduce infections in 0-4 and 5-17 age groups, as expected. They only slightly reduce infections among 18-49, and have little impact on older age groups.
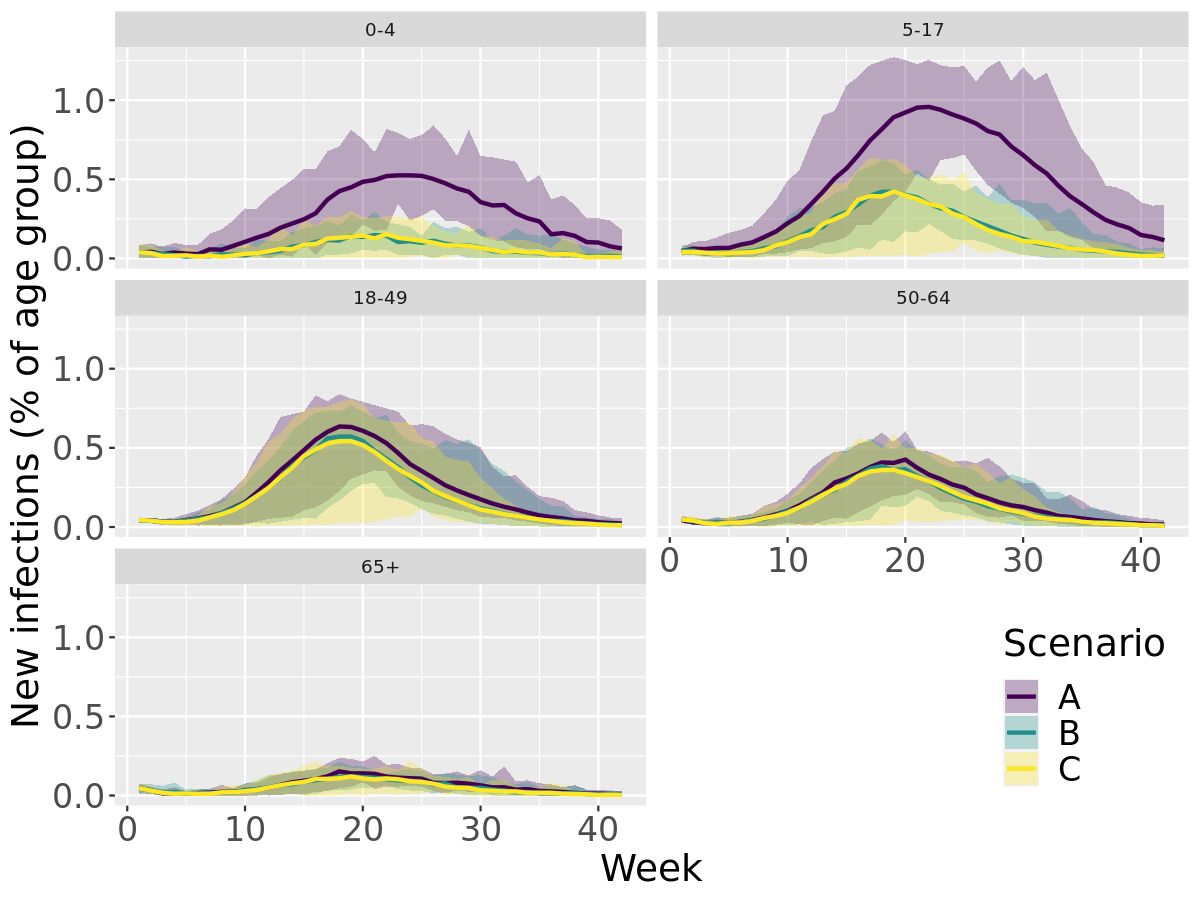
Fig. 3 Weekly new infections by age group. Lines are mean values; ribbons are 90% projection intervals.
The study suggests that in-school NPIs are effective in reducing infections, mainly in the younger population (< 18 years old). To further reduce infections in other age groups, the public health policy makers may consider implementing NPIs in the whole population, including social distancing, testing, and home isolation of positive cases. The effectiveness of these NPIs can be evaluated with an expanded simulation experiment by EpiHiper.